Speak (then drink) like a sommelier

The expert experiences reality differently than the amateur.
Steven Spielberg narrates a movie clip — then you want ‘just the right lighting’ for your next selfie. Gordon Ramsay describes a dish — your stomach rumbles. Elon Musk talks tech — suddenly you want the moon.
An expert sharing about their craft is an invitation for the amateur to see an old topic with new eyes.
I love wine and am an amateur consumer by all measures (except quantity!). Sometimes I taste an exceptional wine that delights the taste buds and boggles the mind. It’s then that I wish to more accurately describe the splendor that is happening in my mouth — much like an expert winemaker might paint a vivid verbal picture of their wine such that you then want a bottle of her wine!
So, I reverse engineered how certified sommeliers speak about wine. Here’s how.
TL;DR
I used machine learning to analyze 130k sommelier reviews of various wines and their respective scores (out of 100). By identifying patterns between wine descriptions and scores, I examined relationships between single words, two- and three-word phrases, and other characteristics that capture the essence of each wine. One interesting question I explored was: Can a wine's variety be predicted from its description alone? This is similar to the 'blind taste test' that aspiring sommeliers must pass, but using only textual descriptions.
The more in-depth explanation…
1. Choose dataset, then wrangle that data
There are many available wine datasets, but few with descriptions captured directly from professionals like a sommelier or winemaker. Luckily, this Kaggle Wine Review dataset suited that particular requirement.
I dropped columns from the dataset (table) that wouldn’t be necessary in the analysis, specifically the Twitter handles column and an ‘Unnamed: 0’ column. Next, I created a new column — ‘ratings’ — that grouped each wine by score (85, 90, 95, 100), then split the entire dataset into training and test data. Lastly, we assigned the target — ‘ratings.’ All that means is that I made the dataset cleaner and smaller.
Time to run our model. I applied TFIDVectorizer and chose to look at every repeating one word, two-word phrase, and three-word phrases in the dataset. Said differently, I started looking for patterns between wine scores and sommelier descriptions using existing data science tools.
2. Identify performance metrics
The primary performance metric is how well this model can predict a wine’s score based on its description.
To do that, we chose what’s known as a target. The target for this dataset is ratings. This column is each wine’s score (out of 100) grouped into categories, or ‘bins’, of 75, 80, 85, 90, 95, and 100.
Wines are ranked from 0–100, but only the last third of the scale is commonly used. For example: wines between 85–90 are decent, but not amazing; wines between 90–95 are delicious; and wines over 95 are some of the best in the world.
3. Model performance on test data
I ran 2 models: RandomForestClassifer and TFIDVectorizer.
RandomForestClassifer resulted in a score of 0.61 (which is not good — you want a score closer to 0.83-ish). After additional tuning, the score dropped to 0.59 (even worse).
The next step is to compare the baseline performance score for this dataset with the test set score.
Baseline performance score: 0.57.
Test set score: 0.69.
The data would indicate that, indeed, the model can predict wine score from description. As referenced earlier, 0.69 is not a great score — but it does show that you can predict how well a wine will score
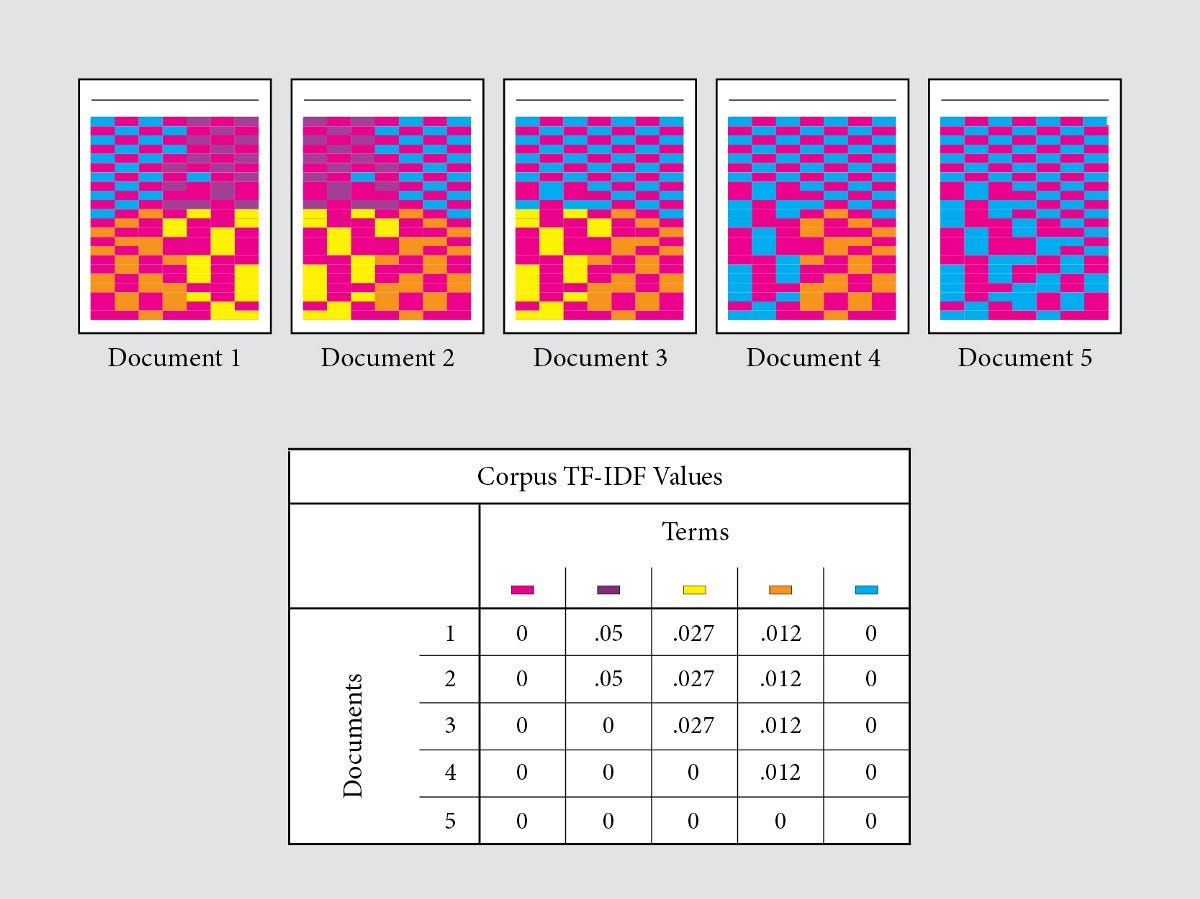
I think it is also valuable to visualize how the Vectorizer works, in order to understand how I’m approaching this dataset. In short, Vectorizer take categorical values — words and/or phrases, separates each word, and gives a value to each word (the value is between 0 and 1.5). See image below.

4. Visualize the data
Here are a few visualizations of the data.

As discussed earlier in this blog post, though the wine scoring system is 0–100, the majority of wines are scored on the last third of that system — so, between 70–100. (Caveat: there are no 70–75 point wines in the dataset because they were all wines that sommeliers reviewed. Sommeliers would not willingly touch a 70 point wine.) The wines in this dataset fall primarily in the last 20% of that 0–100 range, with the average bottle being about 87 points.

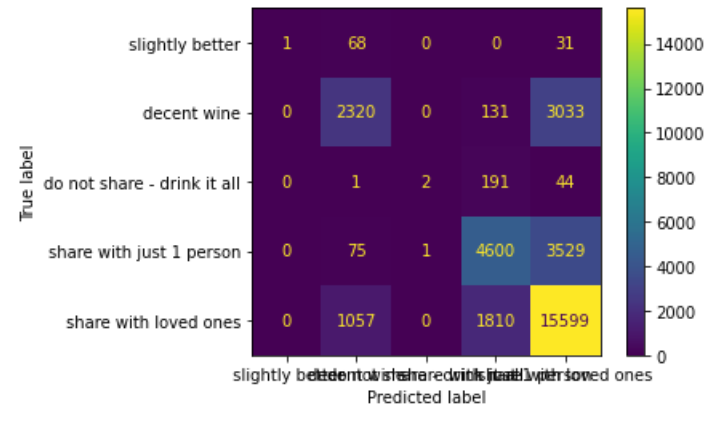
The above graph is known as a ‘confusion matrix’ (the name suits it, right?).

Allow me to interpret the above data for you. In short, some types of wine are easier to predict than others. Were I to repeat this project, I would spend additional time tuning the model to improve the accuracy of the prediction for each type of wine, as opposed to just some of the wines having excellent prediction.
5. Drink
On the macro scale, you can indeed predict a wine bottle’s score by how it’s described. Though there is significant room for error, the data does indicate a strong correlation between word/phrase choice and total score. The model would need additional tuning
On the micro scale, wine is subjective. If you love a bottle of wine, that adoration will shine through in whatever words you choose. Should you ever wish to build on that adoration with more specific terminology, more colorful superlatives, and with a flair commensurate to the splendor in your glass, please do use this project to guide you.
Bon appe-drink,
Lucas